
Every measurement on this page is grounded in real recorded data.
What STRIV measures
See how pressure changes under each foot through a step.
Metrics we use: Time to forefoot peak · Pressure through landing, midstance and push-off
Ground reaction force (GRF) is the force the ground exerts on you with each step.
Metrics we use: Peak vertical GRF · Estimated VALR · Loading time
Pronation excursion shows how far each foot rolls inward. Center of pressure traces pressure from heel to toe and side to side.
Metrics we use: Pronation excursion · Center of pressure trajectory
See both feet side by side across the same run.
Metrics we use: Left / right: Contact time · Force · Pronation · Forefoot timing + more
Track shifts that a single post-run average can miss.
Metrics we use: Loading time · Peak vertical GRF
Pressure appears under the heel
PRESSURE THROUGH STEP- Landing · heel
- 64.7 / 61.1% L/R
- Midstance · left
- 51.2% medial · 48.8% lateral
- Midstance · right
- 48.1% medial · 51.9% lateral
- Push-off · forefoot
- 68.8 / 64.4% L/R
The left keeps more pressure at heel landing and forefoot push-off, while the right shifts slightly outward at midstance. The two feet follow distinct pressure paths through the same step.
Recorded pressure from 128 sensors per foot, slowed down. Colors show relative pressure within each foot.
Your stride.
Your baseline.
One run shows how you move. Your running history helps you see what changes. Form Score brings your movement into one view, with a baseline that becomes more personal as you log runs.
The shaded band shows this runner’s usual score range.
Explore your Form Score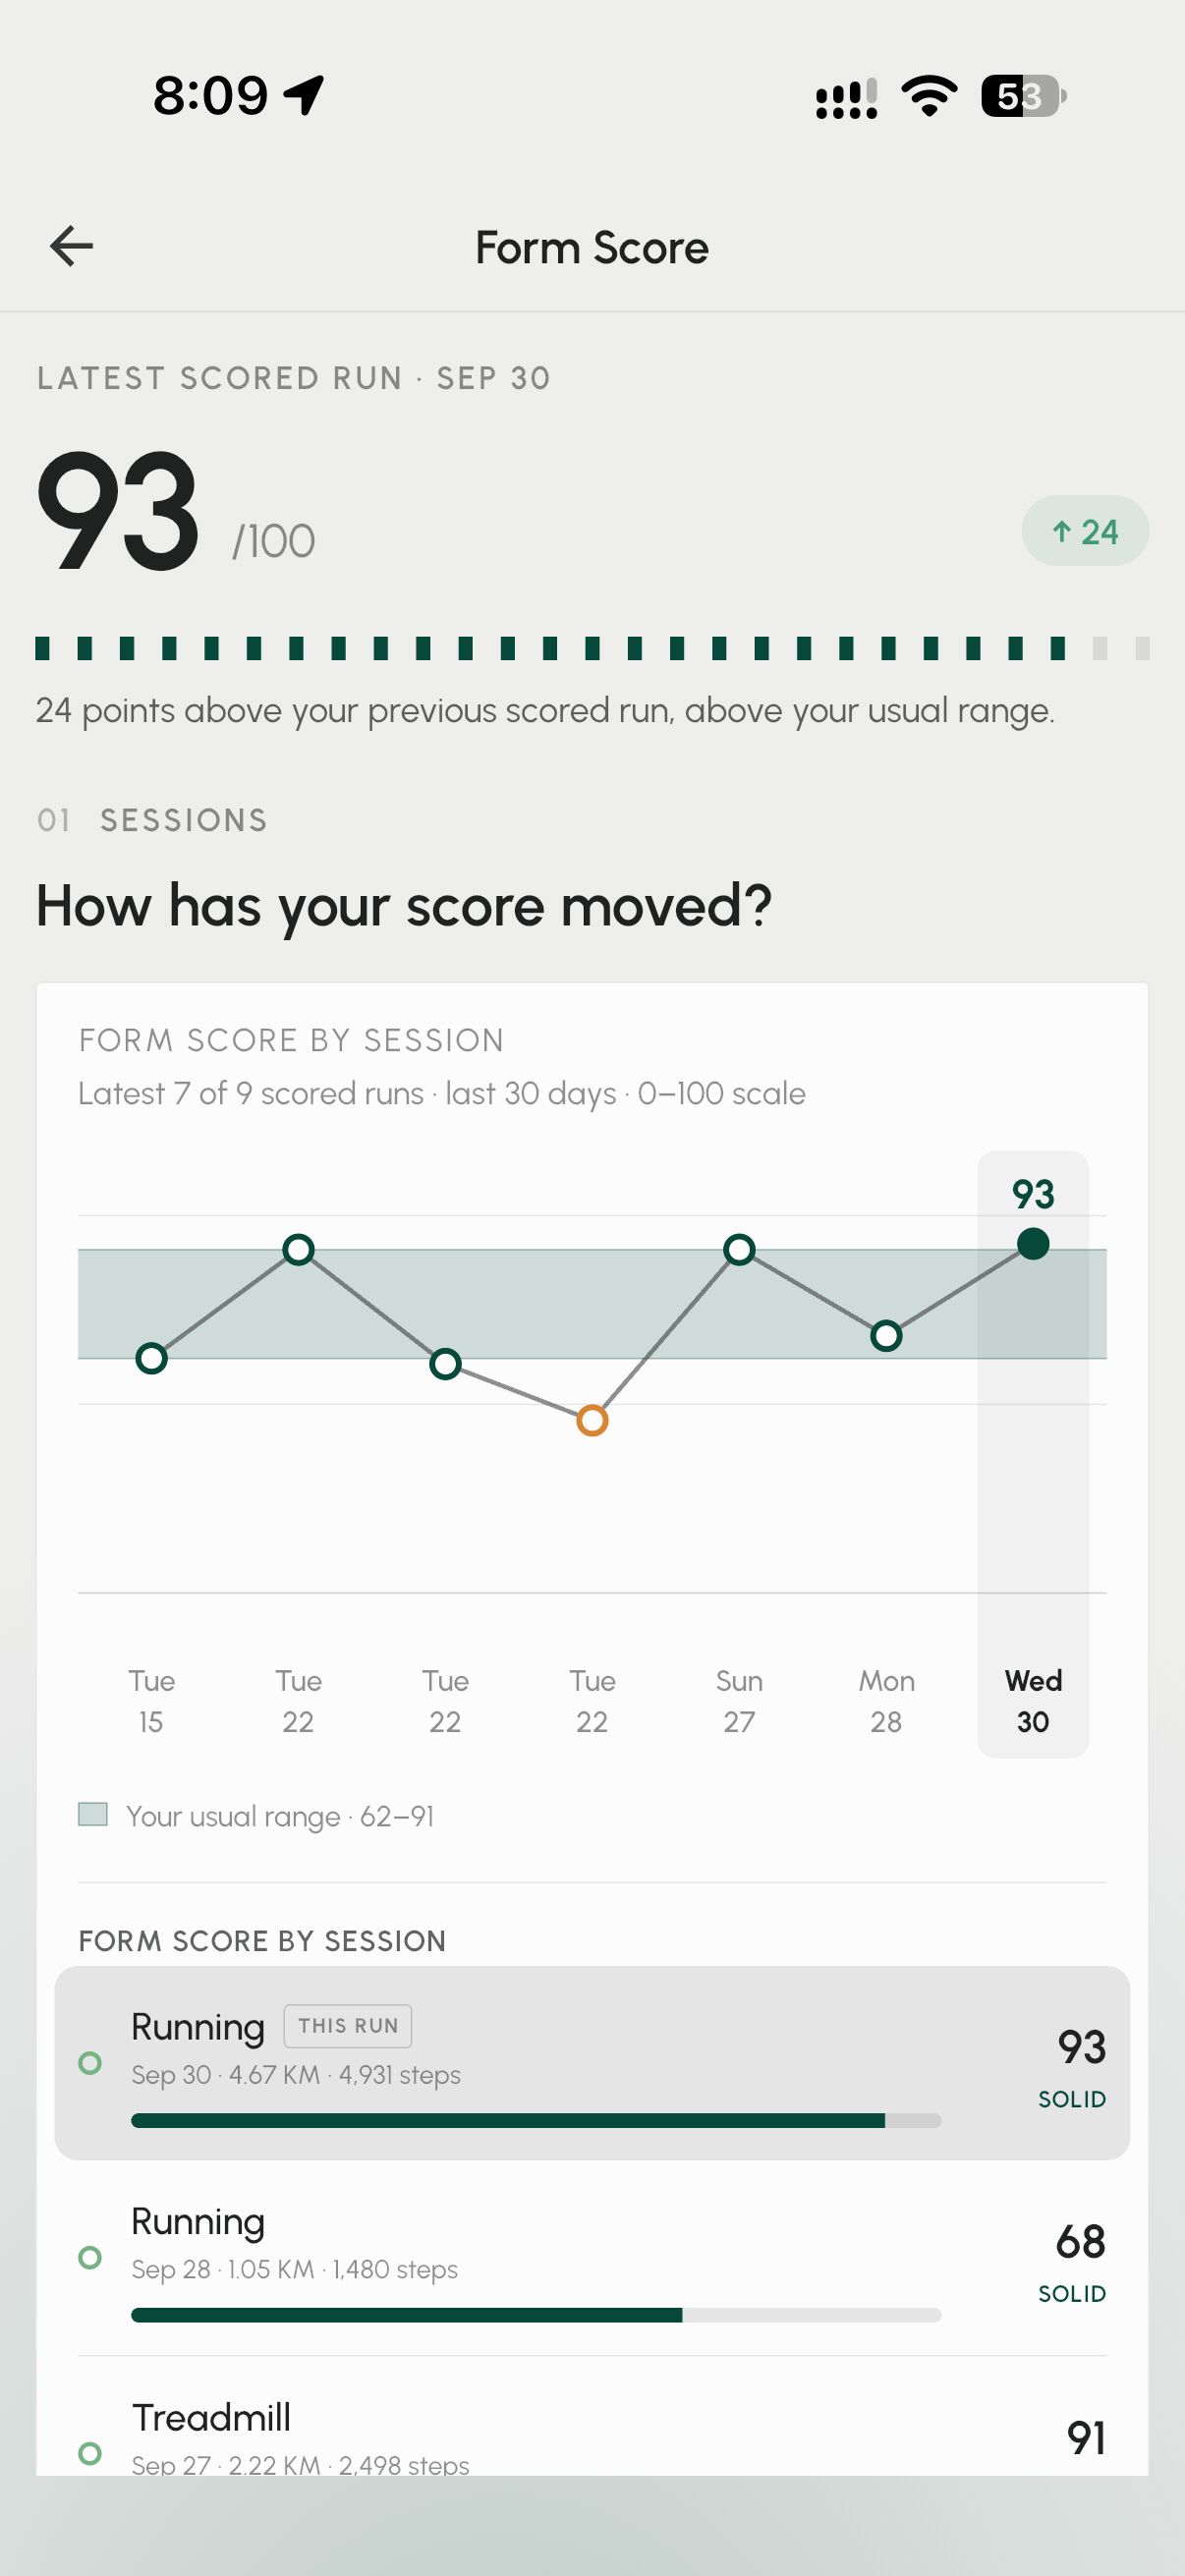
Lab-grade, inside the shoe.
We test STRIV side by side with the equipment biomechanics labs rely on: a Bertec force-plate treadmill and a Footscan pressure plate.
- r0.975
- Peak forcevs Bertec force-plate treadmill
- r0.975
- Ground contact timevs Bertec force-plate treadmill
- r0.998
- Center of pressure, heel to toevs Footscan pressure plate
Bertec: 24 runners, over 40,000 steps. Footscan: 52 feet, 394 steps.
See how we test